Discover all available widgets in the reporting tool
There are twelve widget types you can choose when using or designing a report. Eight of the twelve can interact with the scoring functions of the meeting software
Widgets working with the scoring functions
1. Score Overview
2. Score Category Results Widget
3. Score Details Widget
4. Project Roadmap Widget
5. Project Scope Widget
6. Report Score Compare Widget
7. Tasks Widget
8. Service Selector Widget
Widgets working separately from the scoring functions
9. Service Review Widget
10. Scorecard Widget
11.Scorecard
12. Content Widget
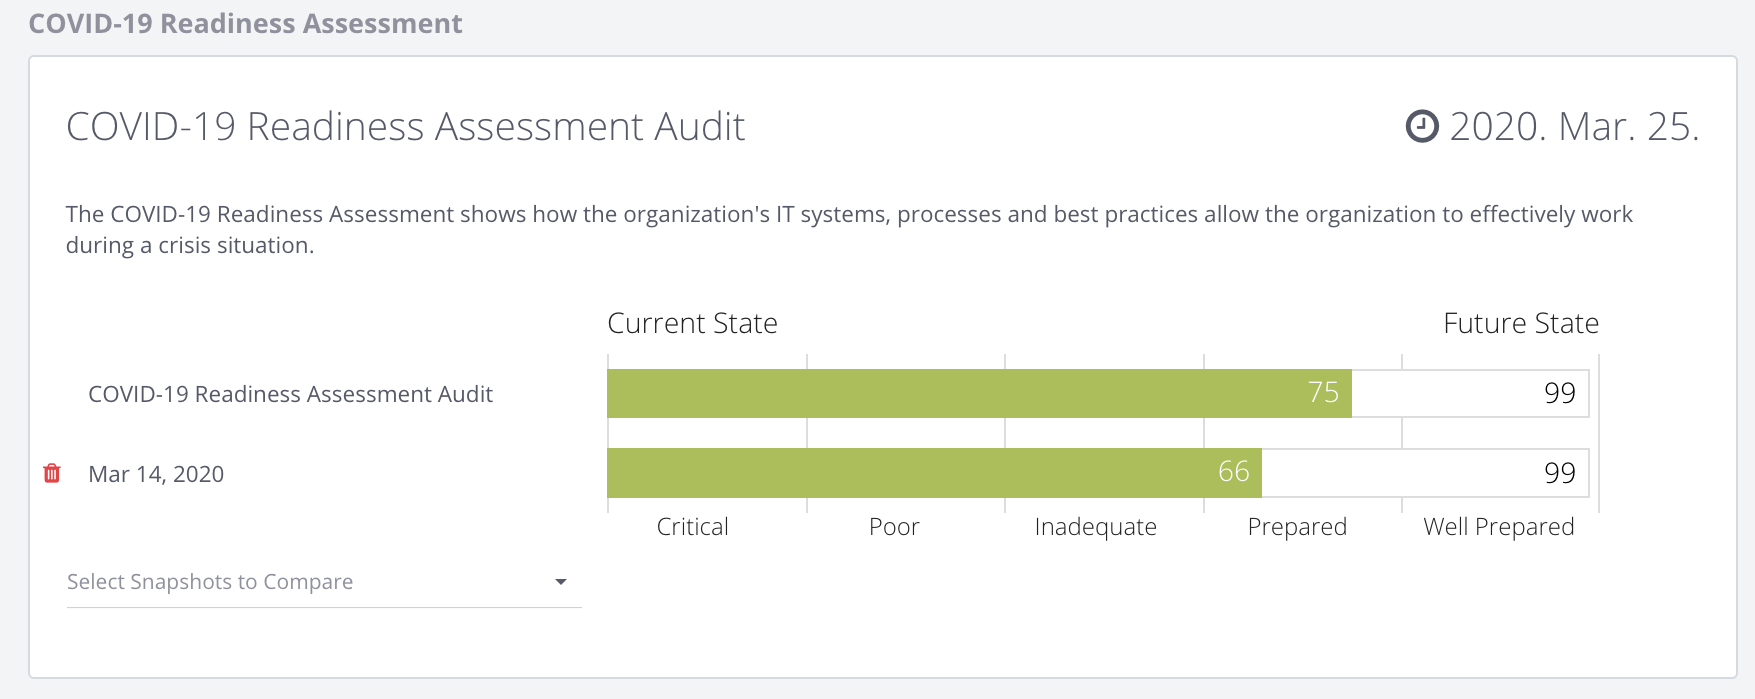
1. Score Overview
The Score Overview Widget shows the overall score of the report.
- add and compare using multiple snaphshot scores
- edit the name, description, colour scheme and segment names in the report editor
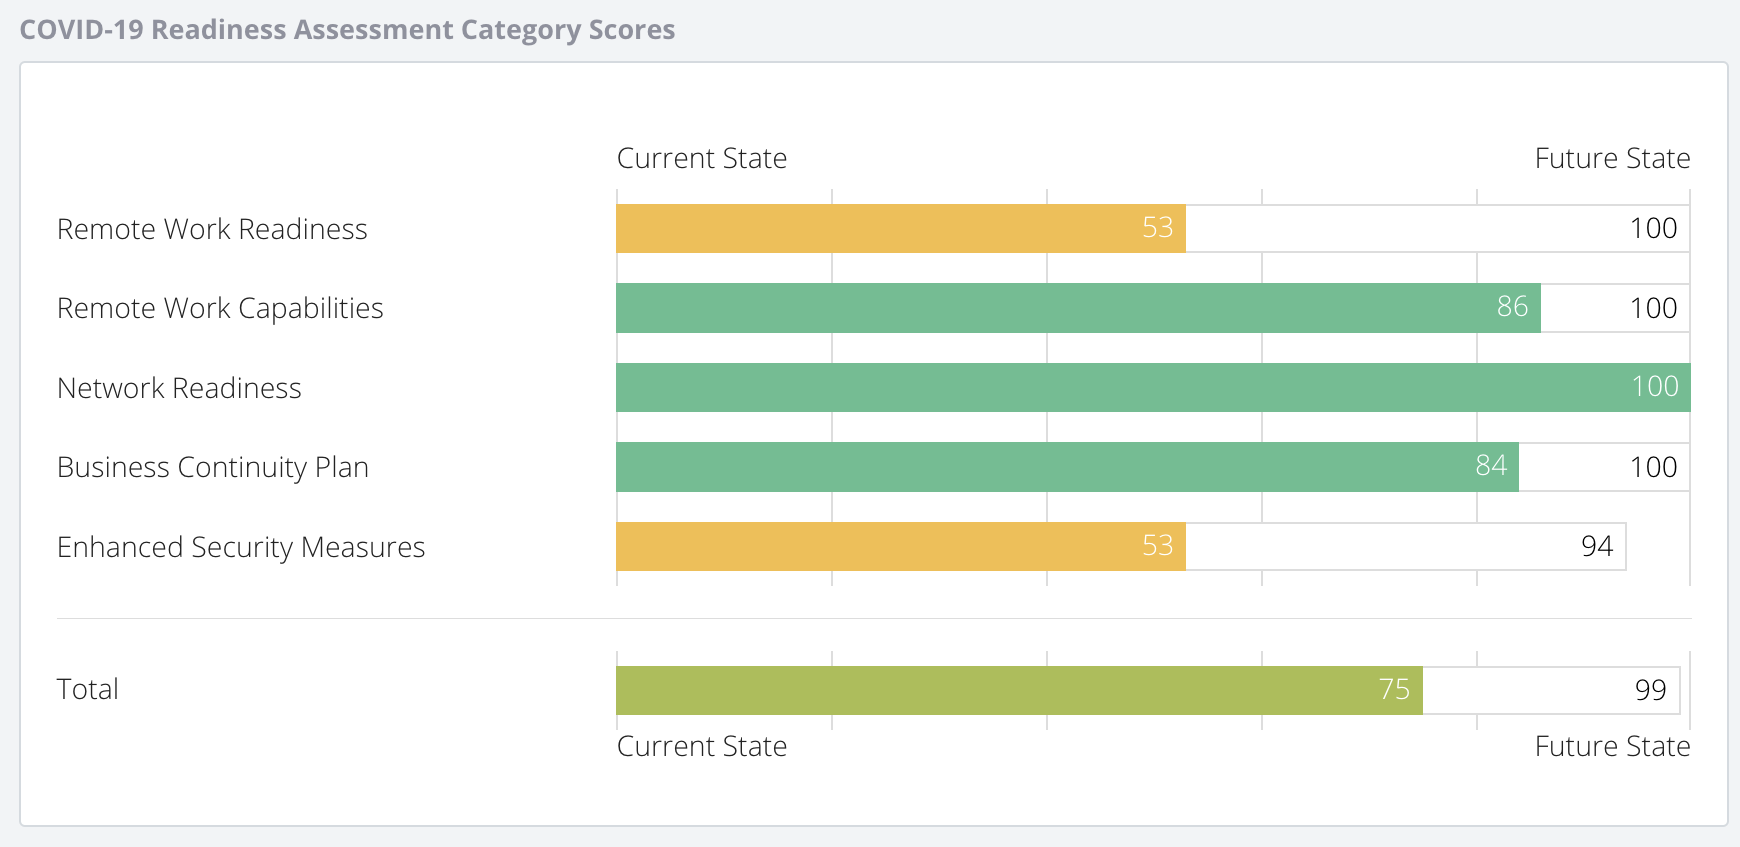
2. Score Category Results Widget
The Score Category Results Widget shows Category Breakdowns of the report.
- Hidden subcategories are not counted
- edit the colour scheme in the report editor
- Click on a category to go see its scoring breakdown
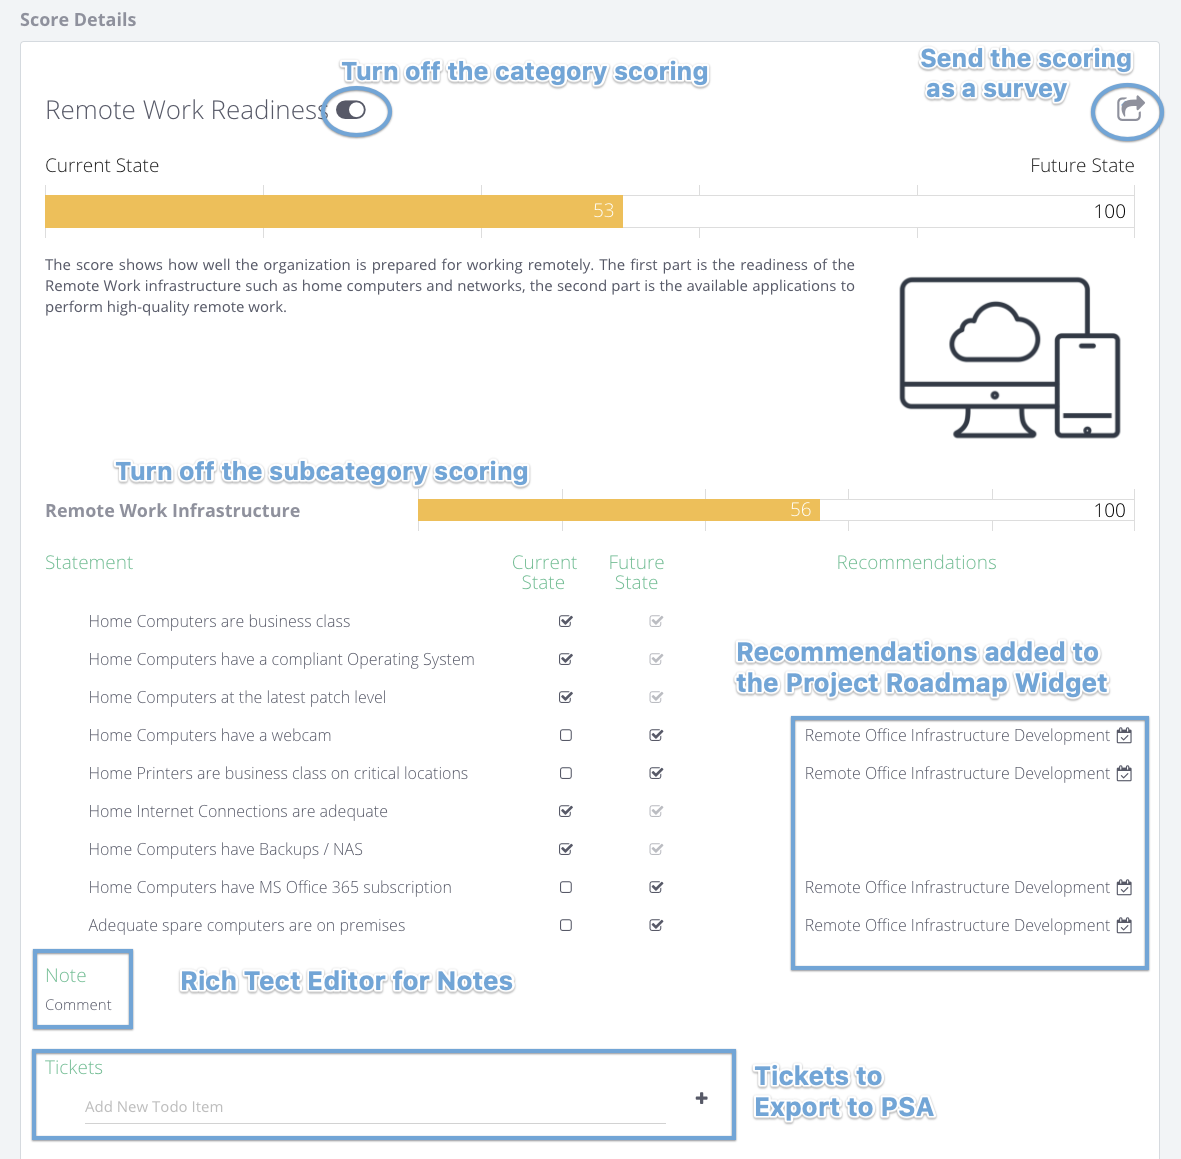
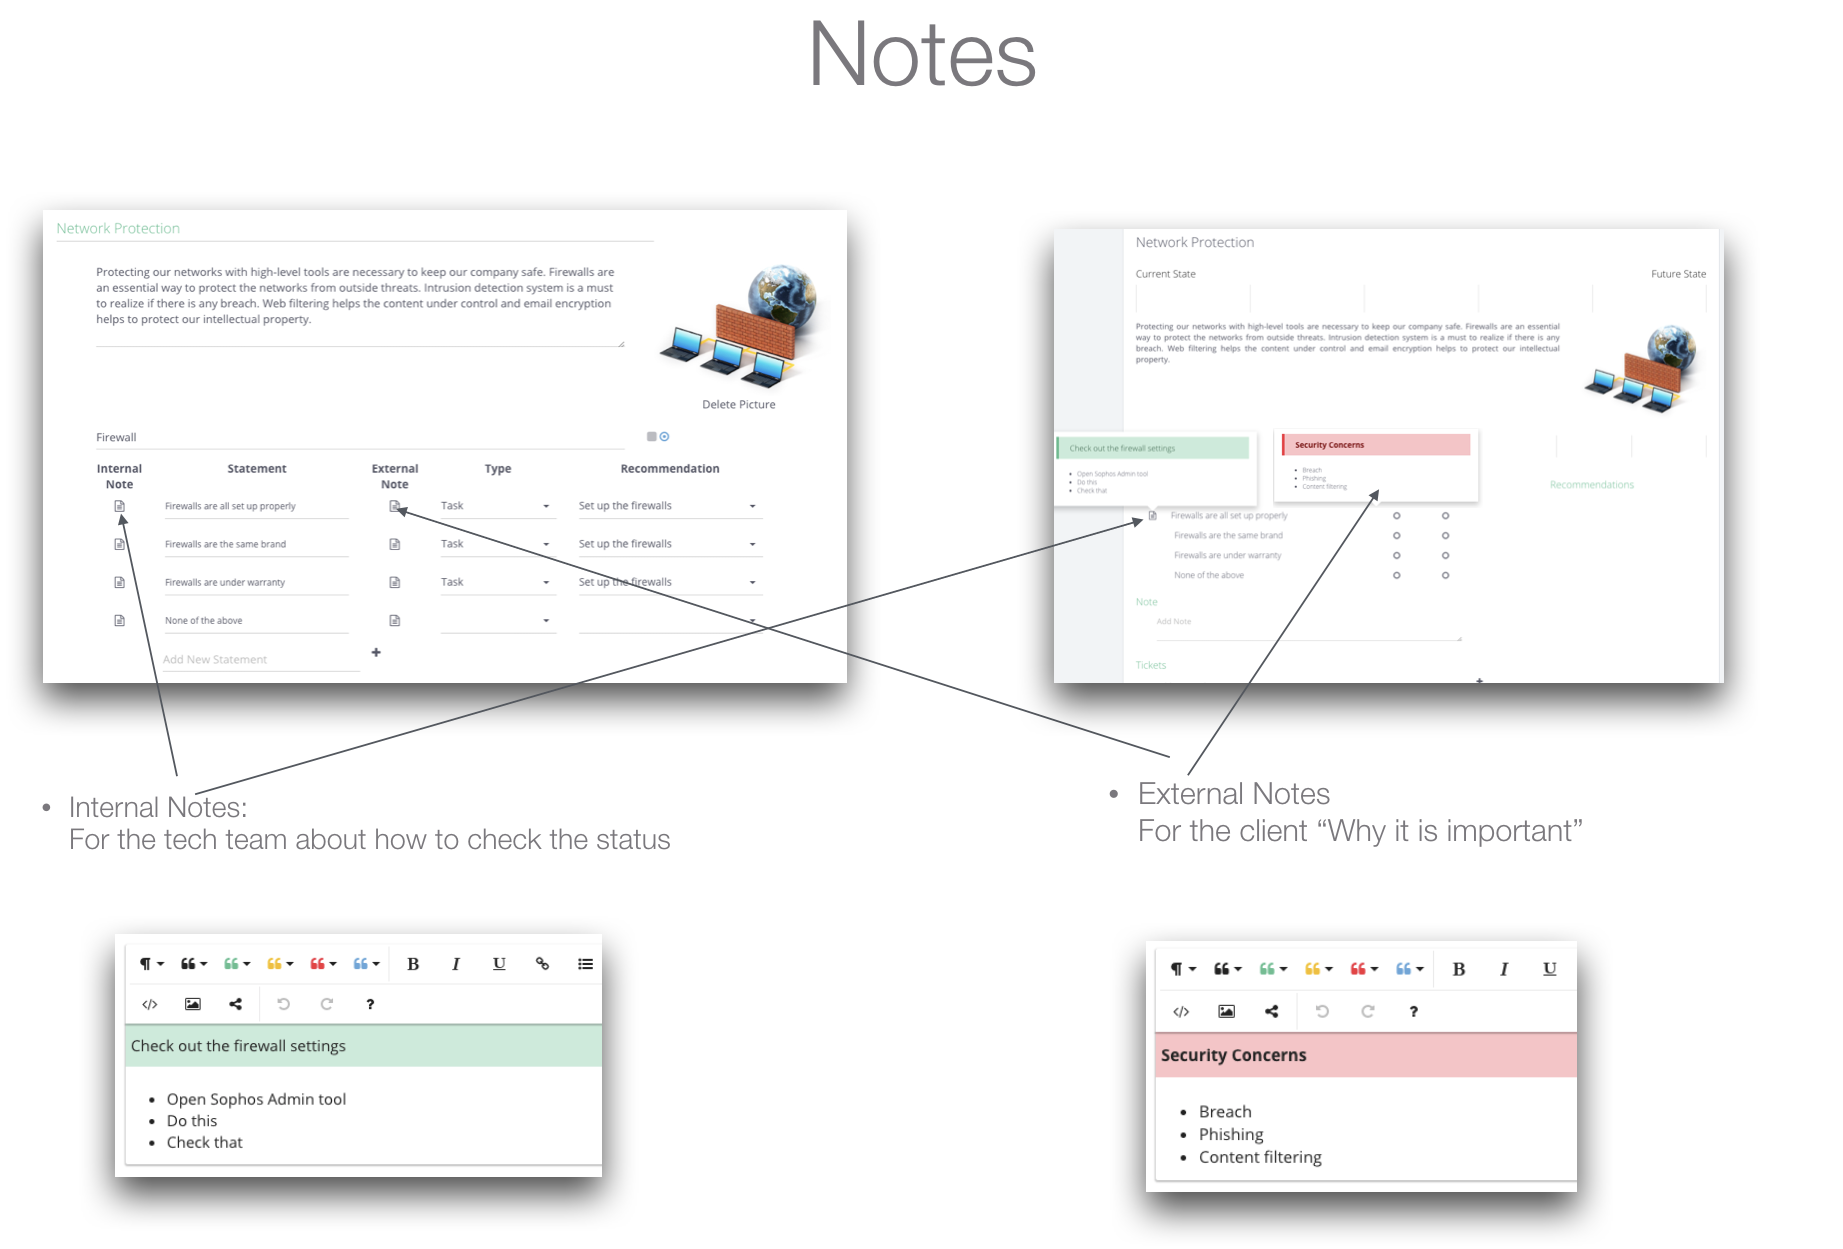
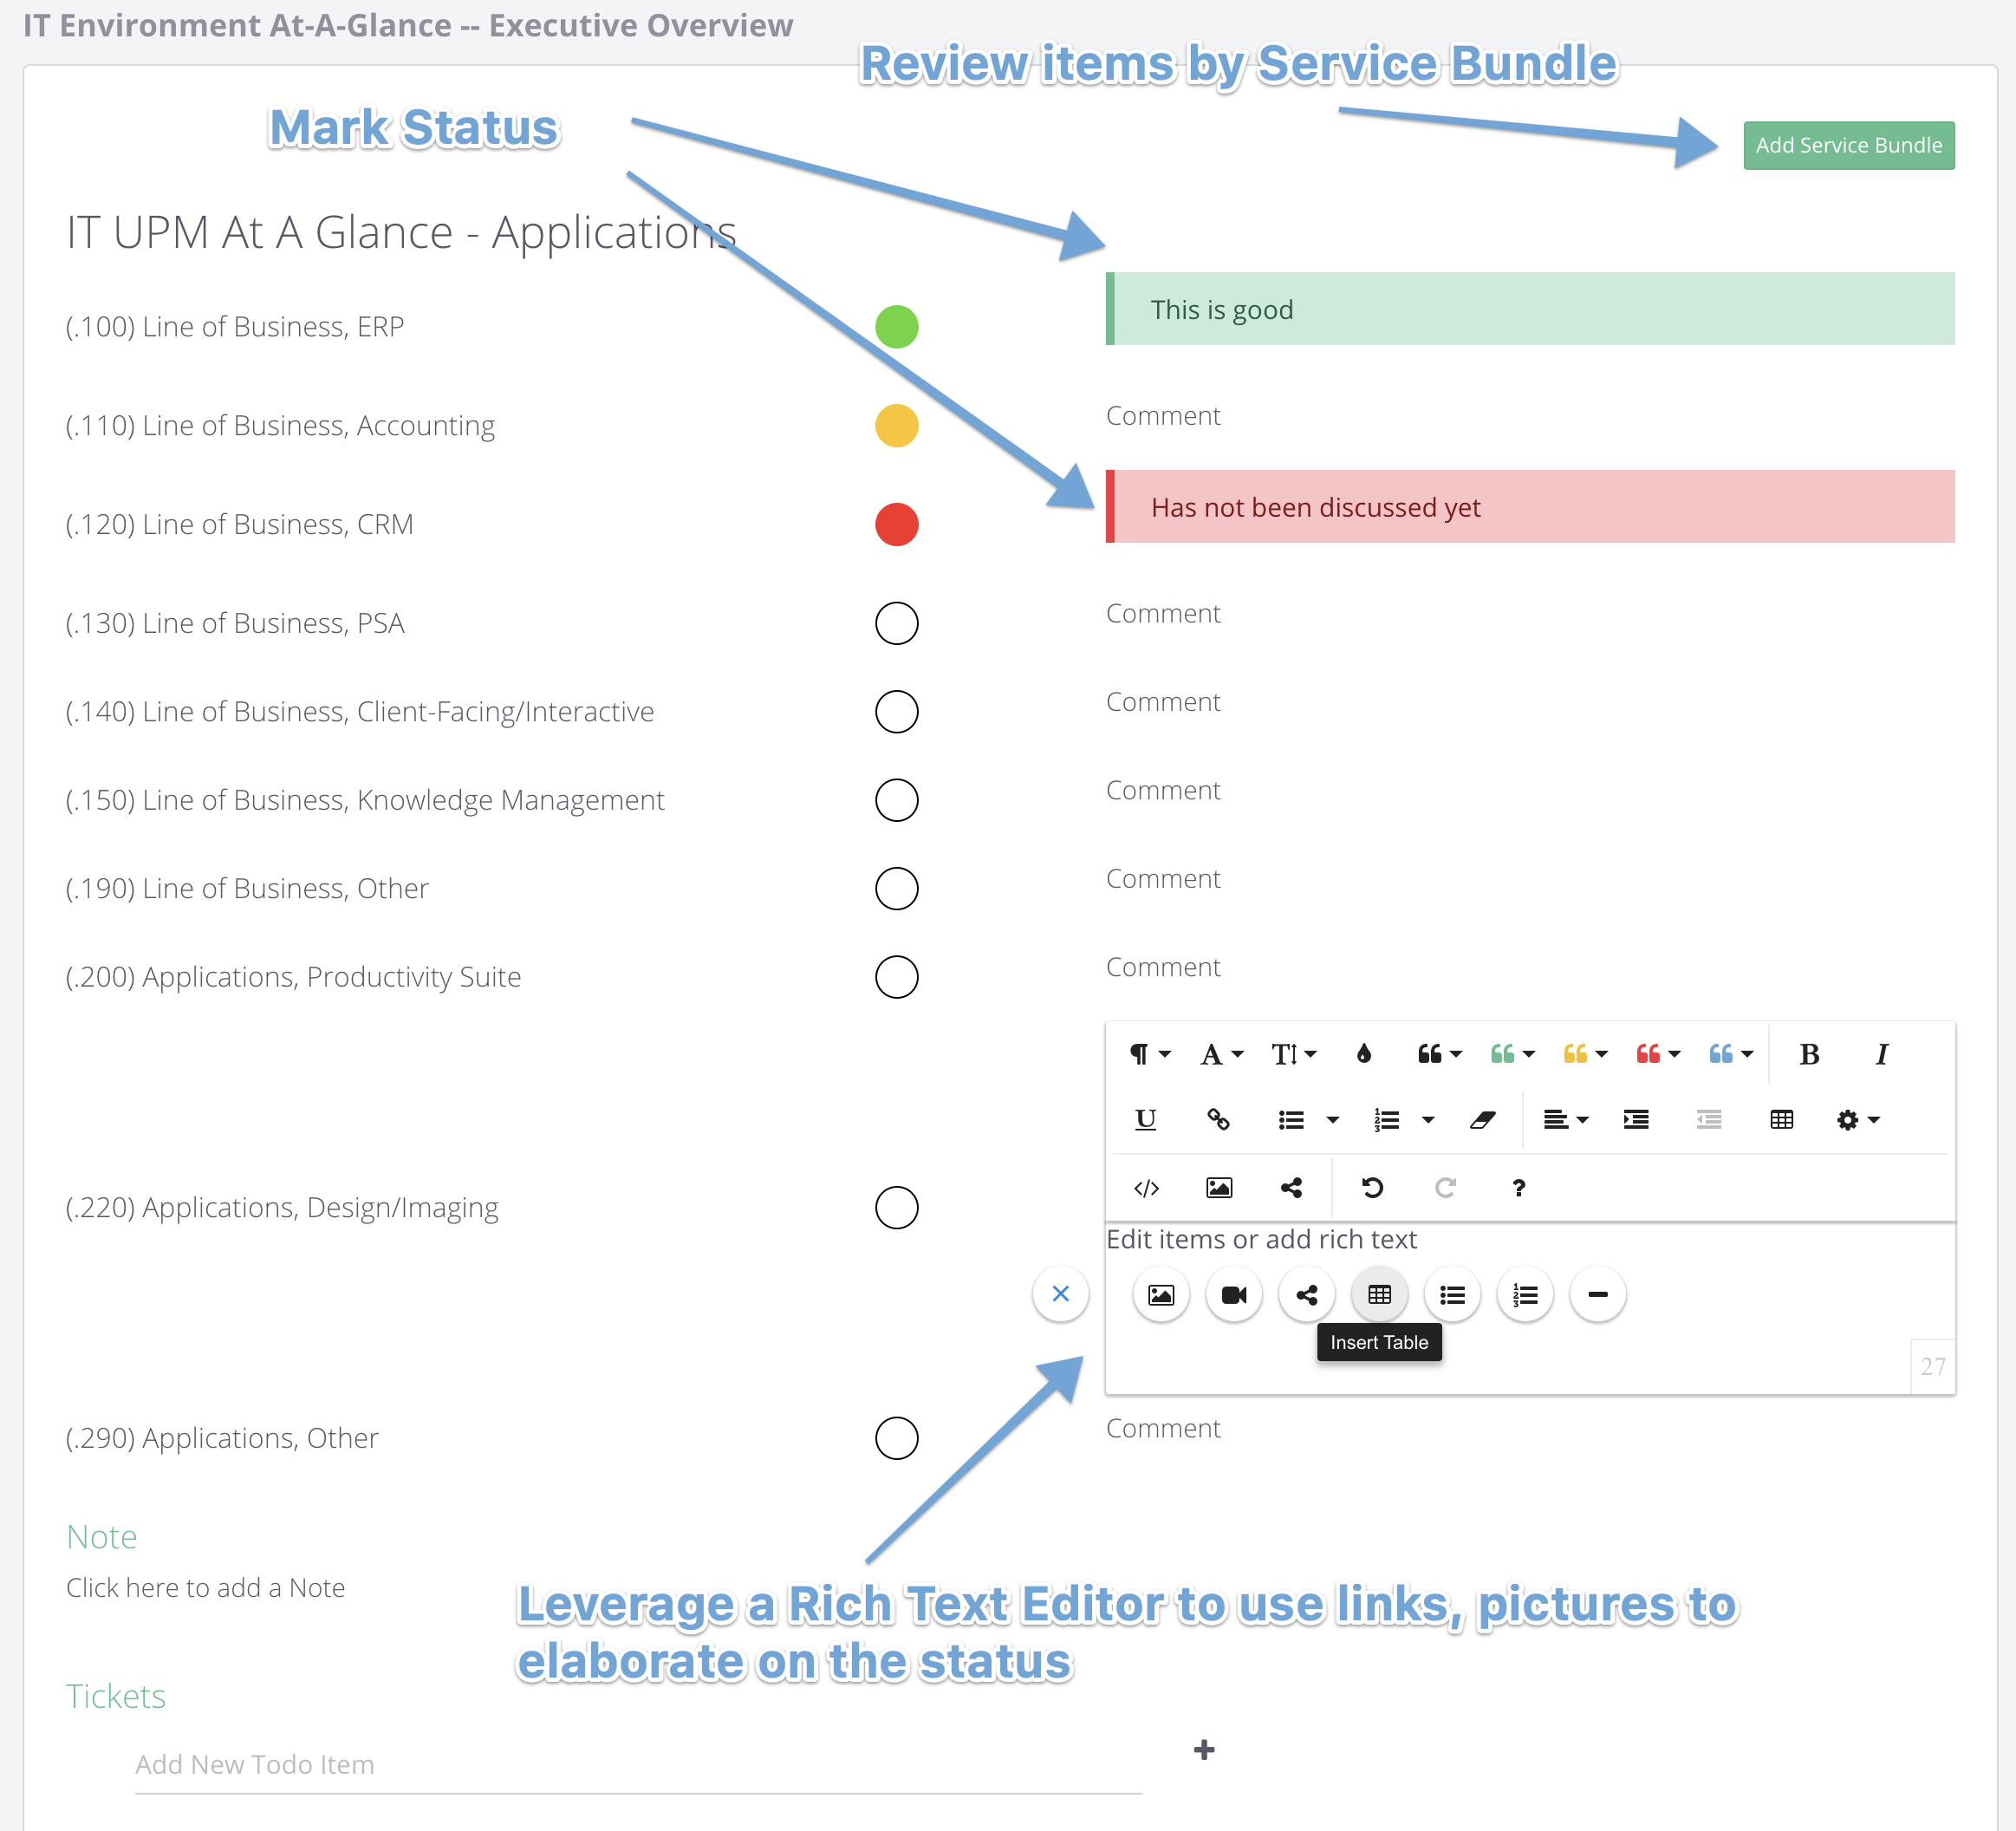
3. Score Details Widget
The Score Details widget is used to edit the scores, recommendations, current state, future state and tickets.
- toggle categories and subcategories from the scoring
- send the scoring as a survey to a tech, vendor or a client
- edit the scoring profile in the report template editor
- define Internal and External notes for each statement
- link recommendations to each statement
- set your recommendations as Projects (Project Roadmap Widget), Services (Service Selector Widget) or Tasks (Task Widget)
- add a rich text Note to the subcategory
- add a ticket to a subcategory with description and hours then send it to your PSA
Internal Notes: for the tech team about how to check the status
External Notes: For the client "why this is important"
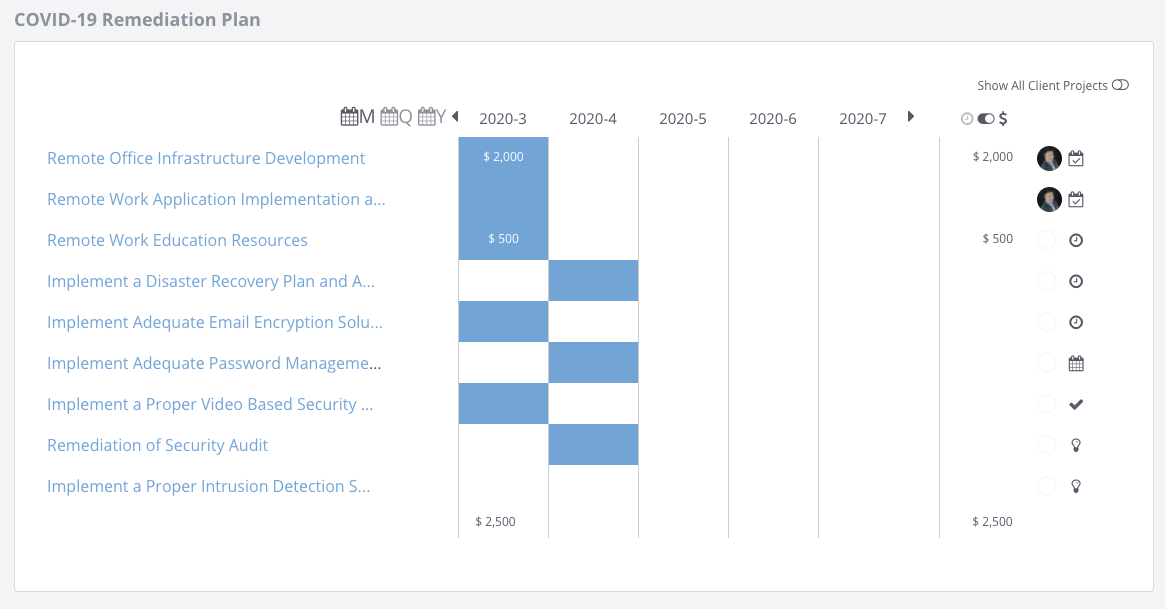
4. Project Roadmap Widget
The Project Roadmap Widget is used to generate a project roadmap for a client based on the scoring recommendations, project template library projects or custom projects.
- switch between Monthly / Quarterly / Yearly view
- view all client projects (Show All Client Projects on) or just those related to the scoring (Show All Client Projects off)
- add timeline (by clicking on the grid)
- add budget / time estimations (clicking on the timeline blue items)
- assign responsibility for each project (Team Plan)
- select a status from the dropdown (as well as customize the status icons and names)
- edit a project by clicking the link (edit the description, deliverables, name and picture)
- add Ongoing service budgets (add it on the annual view and this spreads the budget over the year, months and quarters)
- add a project from scratch to the bottom of the stack (Show All Client Projects should be turned on)
- order projects by drag and drop (Show All Client Projects should be turned on)
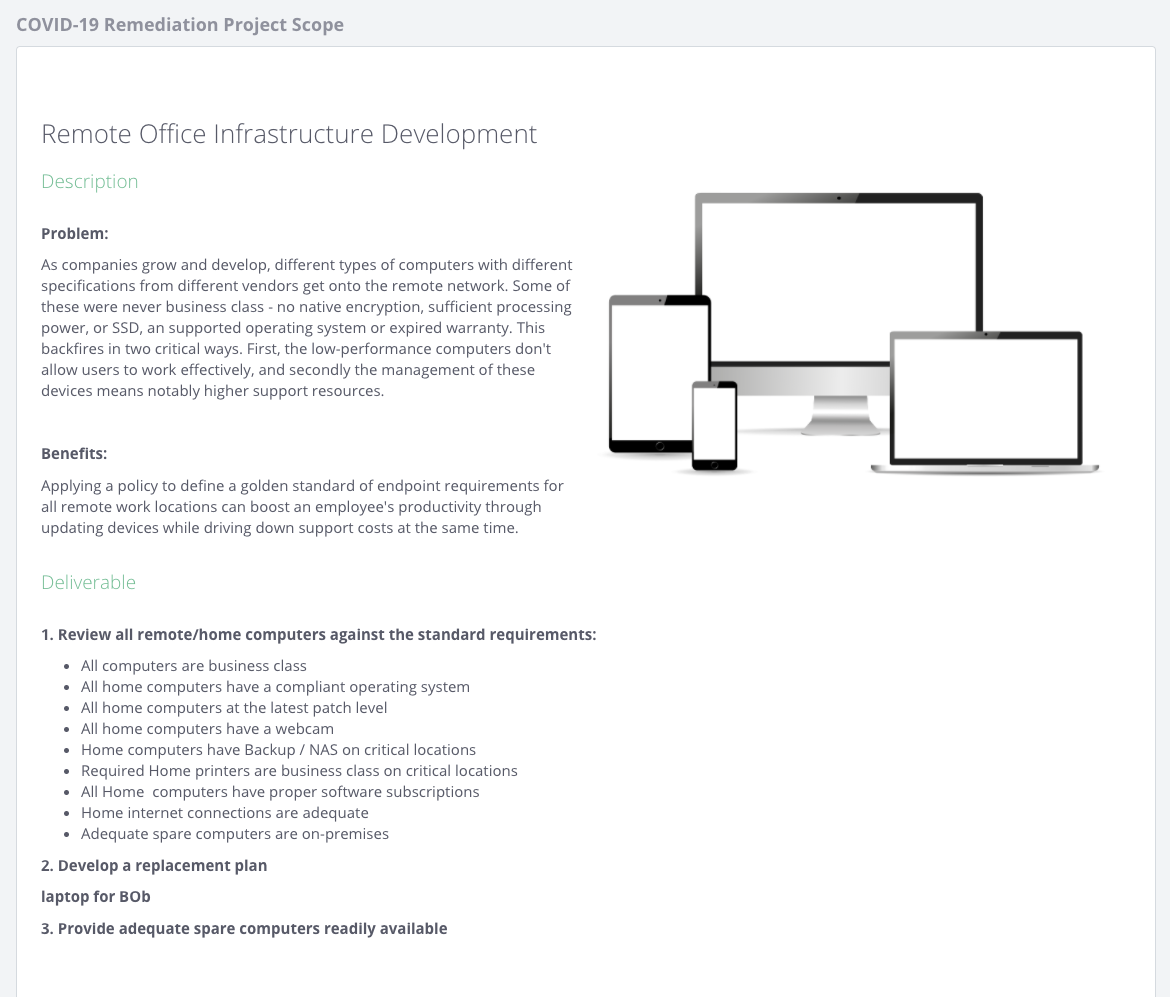
5. Project Scope Widget
-
The Project Scope Widget prints all project details (name, description, deliverables and picture) to the canvas.
- customize the name, description, deliverables or the picture by clicking the project on the Project Roadmap Widget
- embed rich-text and even videos into the fields to make your presentation interactive
- the project roadmap estimated budget appears at the bottom of the page
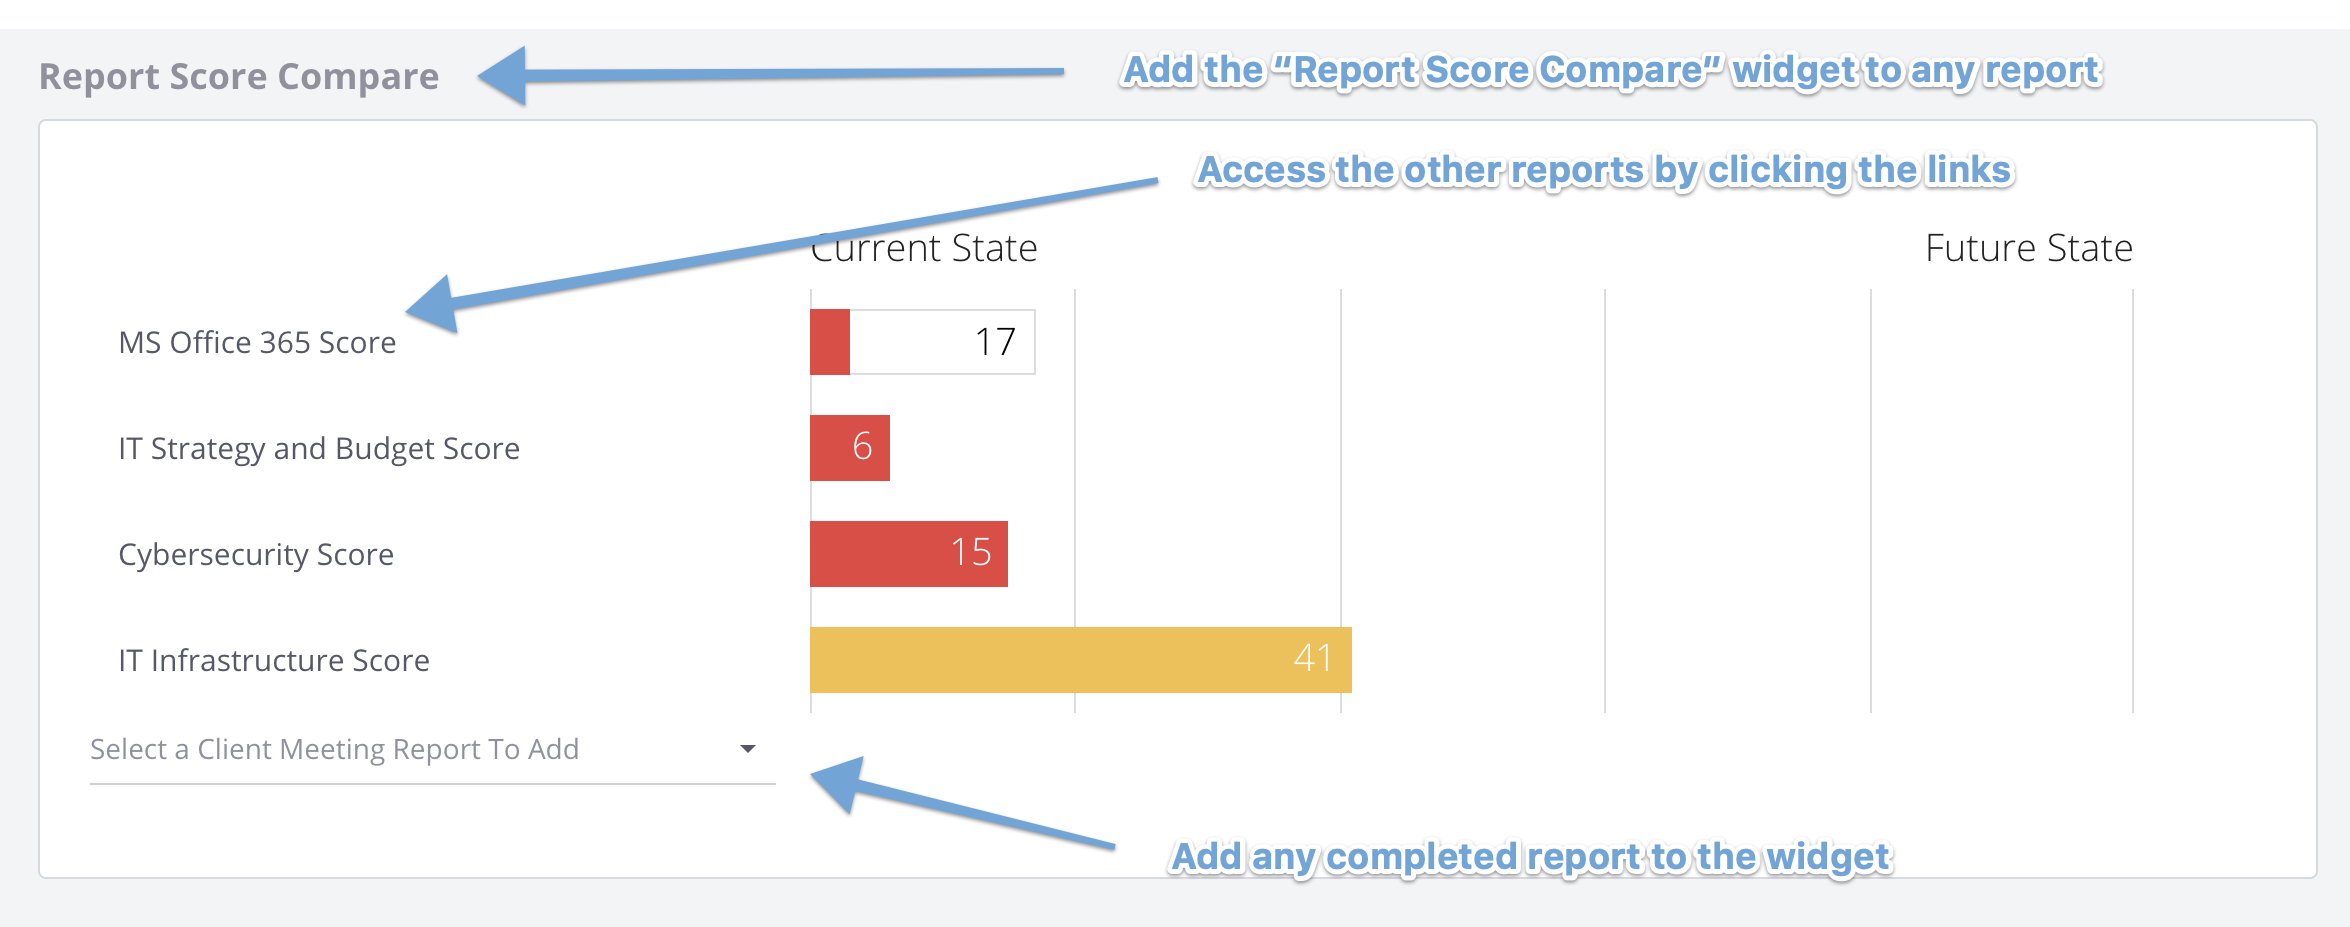
6. Report Sore Compare Widget
The Report Score Compare Widget is used to combine multiple scores from different reports into one place.
-
- Have one report for Periodic Reviews such as Quarterly Business Reviews / Semi Annual Technology Reviews / Monthly Success Reviews and separate reports to elaborate on different important topics such as Technology Health Audit / Cybersecurity Audit / IT Strategy Workshop / Office 365 Audit.
- make all report scores visible in one widget. This way you can manage the scores of different issues separately without overwhelming the client. Add this widget to any report any time using the + button in the top right corner of any other report widget.
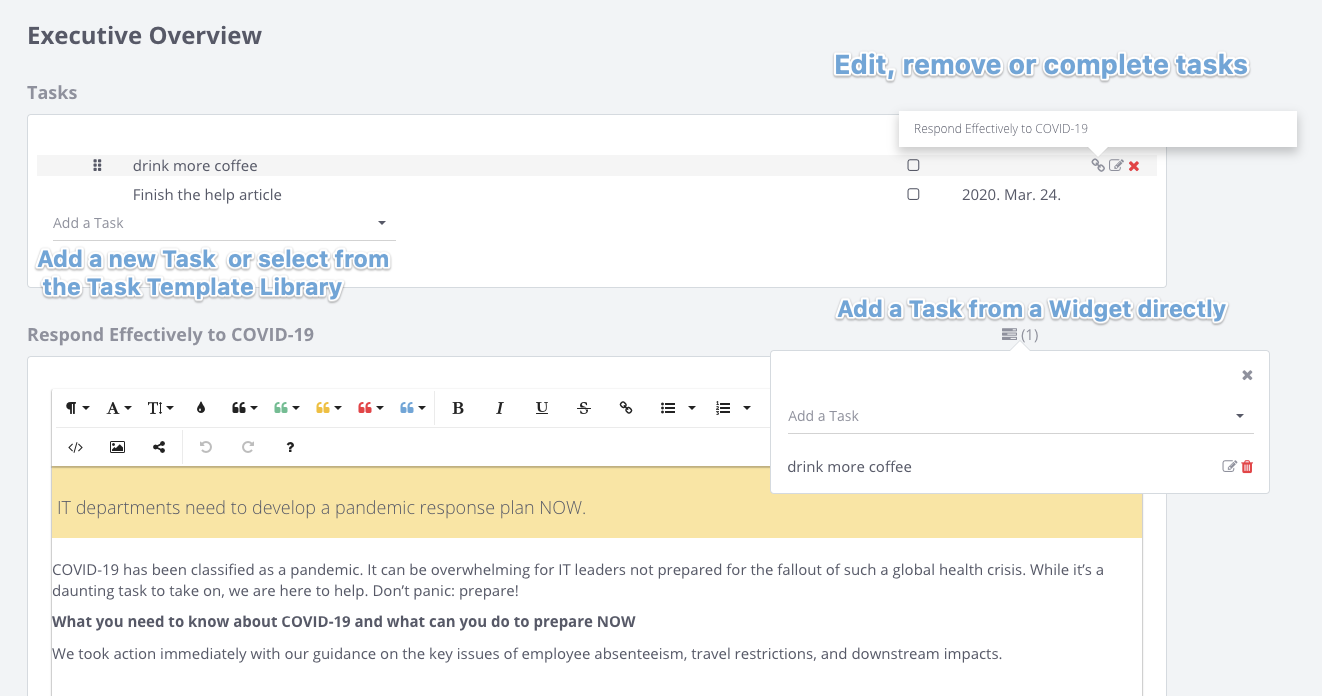
7. Task Widget
The Task Widget is used to collect tasks from various places of the report.
- add a task from your predefined Task Template Library (Setup Menu) or from scratch
- add a description and a deadline
- add tasks from Task Recommendations (Score Details Widget)
- add tasks from each widget's header
- reorder the tasks - drag and drop
- export tasks as tickets to your PSA
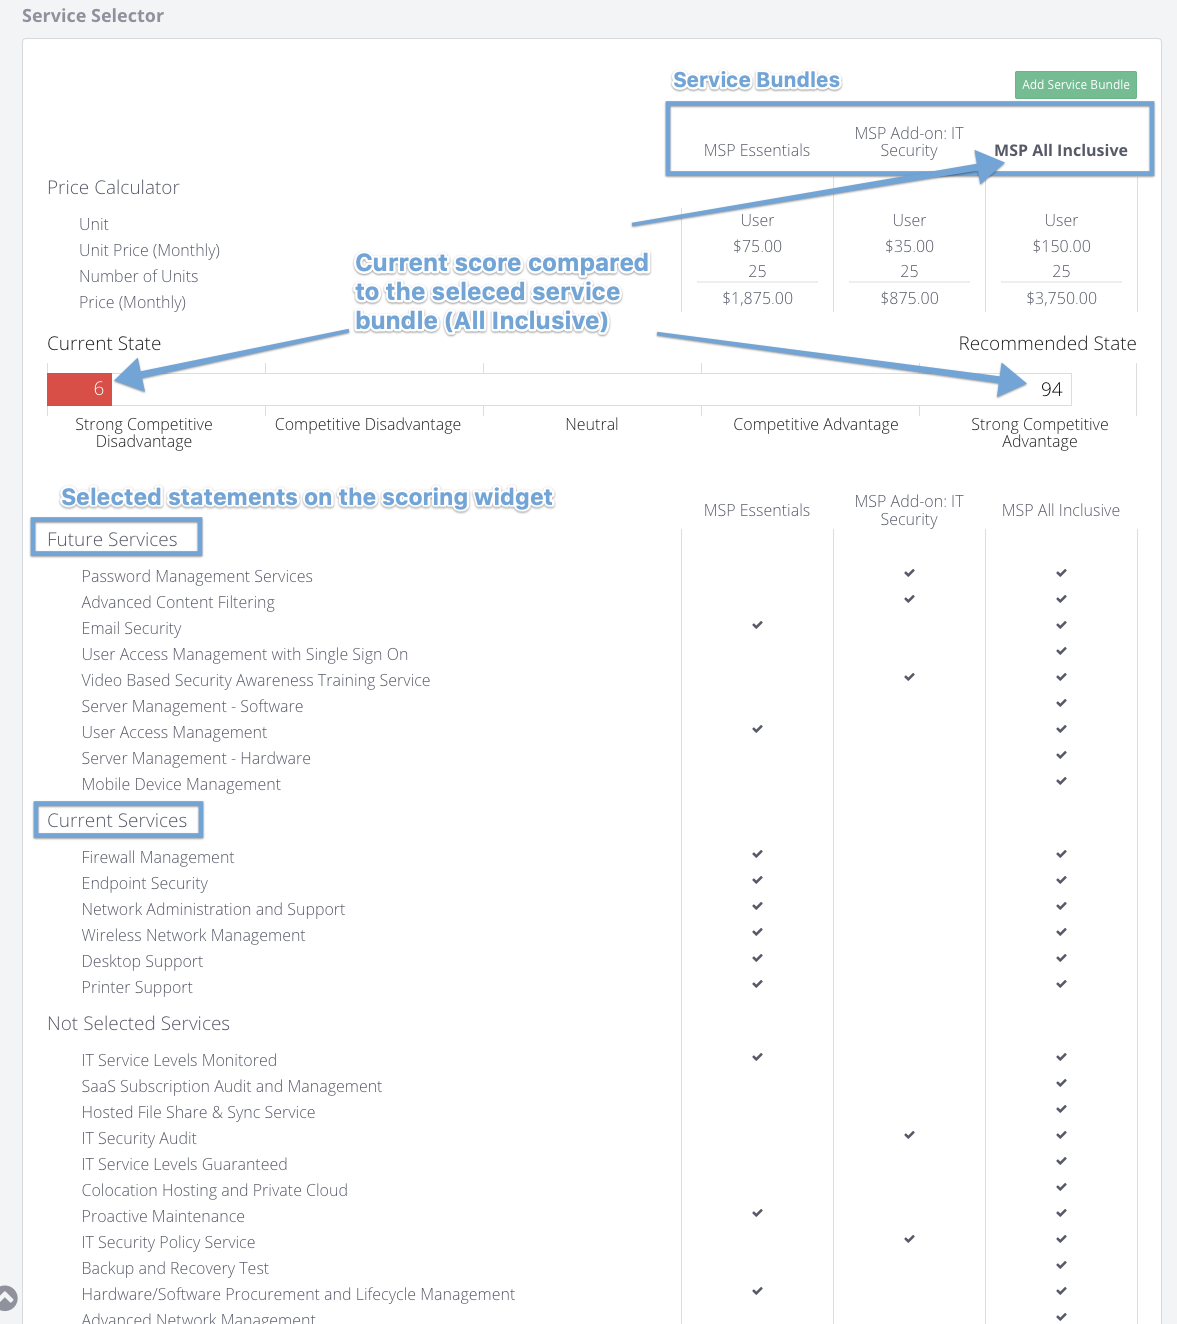
8. Service Selector Widget (Delegate and Team Plans)
-
Service Selector Widget is used to compare different service plans based on the scoring.
- add multiple service bundles to the widget
- add pricing for each tier or add-on
- see the overall current scores
- compare current scores to individual service bundles (what if)
- see what service lines were issues during the scoring (future state)
- compare all the line items on different plans
9. Service Review Widget (Delegate and Team Plans)
Service Review Widget is used to review your service line items and service bundles with clients.
- rate service line items (neutral, green, yellow and red)
- comment on service line items (with rich text highlights)
- take notes for service bundles
- generate tickets for service bundles and export them to your PSA
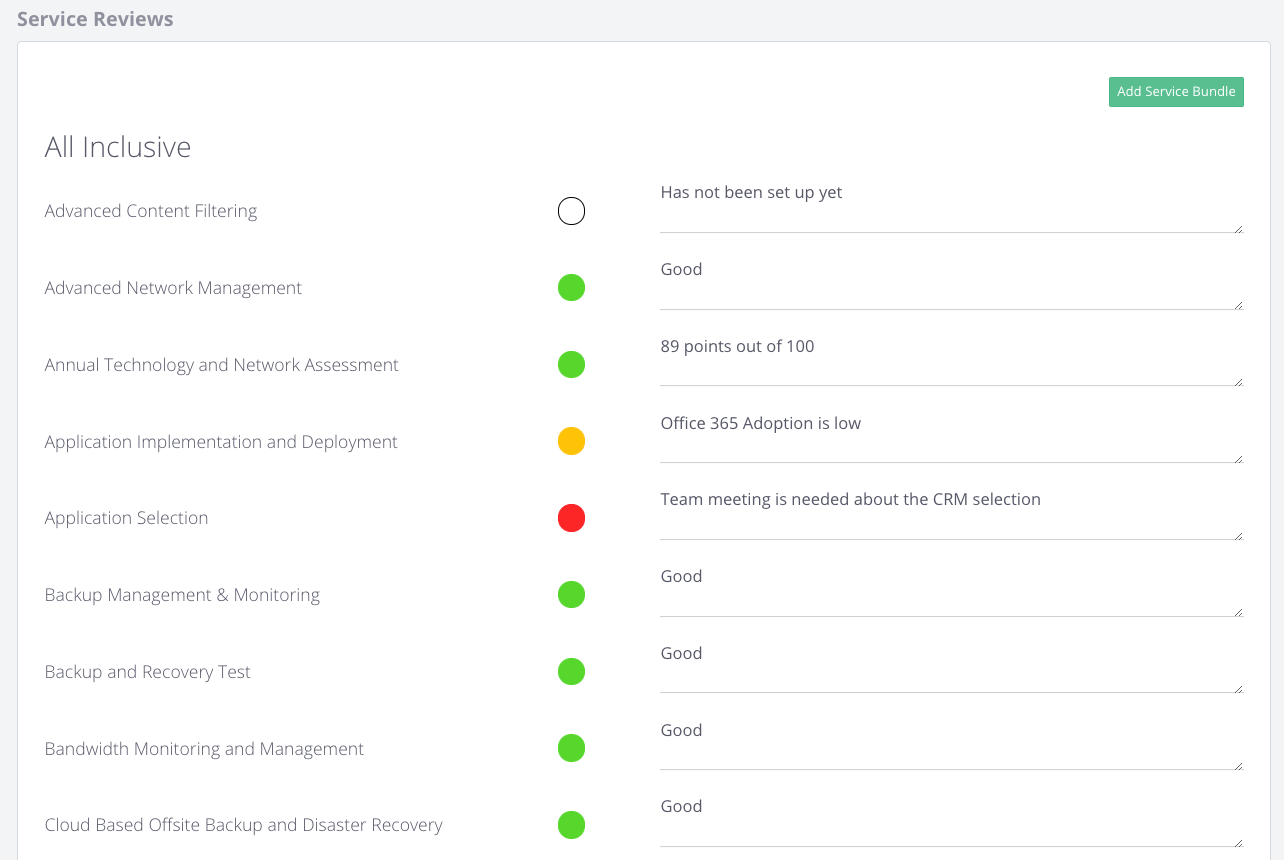
- use the rich-text editor to highlight issues more specifically
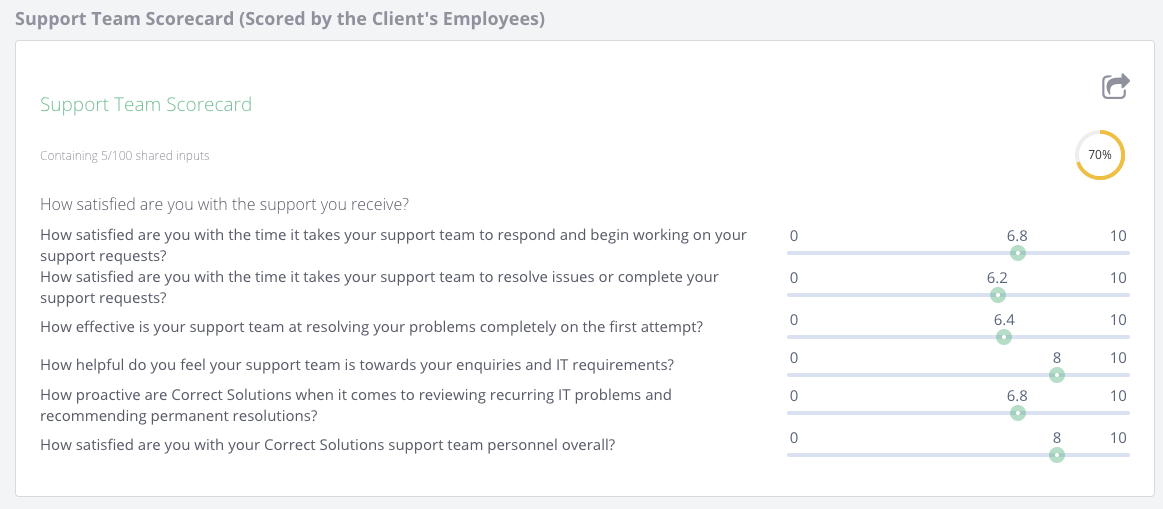
10. Scorecard Widget
Scorecard Widget is used to gather more information internally or externally and present it in the report.
-
- send surveys to users
- review individual responses
- restrict scores that can be completed within the report
- limit the number of completions
11. Scorecard Summary Widget
Scorecard Summary Widget is used to present the different scorecards to an executive overview.
- You can gather add a scorecard for manual %
- You can send scorecards out to users, clients or your team

12. Content Widget
Content Widget is used to add HTML-based content to the reports. Feel free to use the rich-text editor, add interactive elements or embed various tools.
-
- Fully functional HTML editor
- Meeting notes, agenda items, scripts or guides to help the facilitators manage the report
- Interview questions to collect information while reviewing the report or prior
- Checklist for team members to complete the different parts of the report
- Embedding 3rd party applications like Office365 Word/Excel/Powerpoint, Lucidchart, Google Documents
- Include web-based pictures as illustrations or supporting documents